
01
Live dashboards
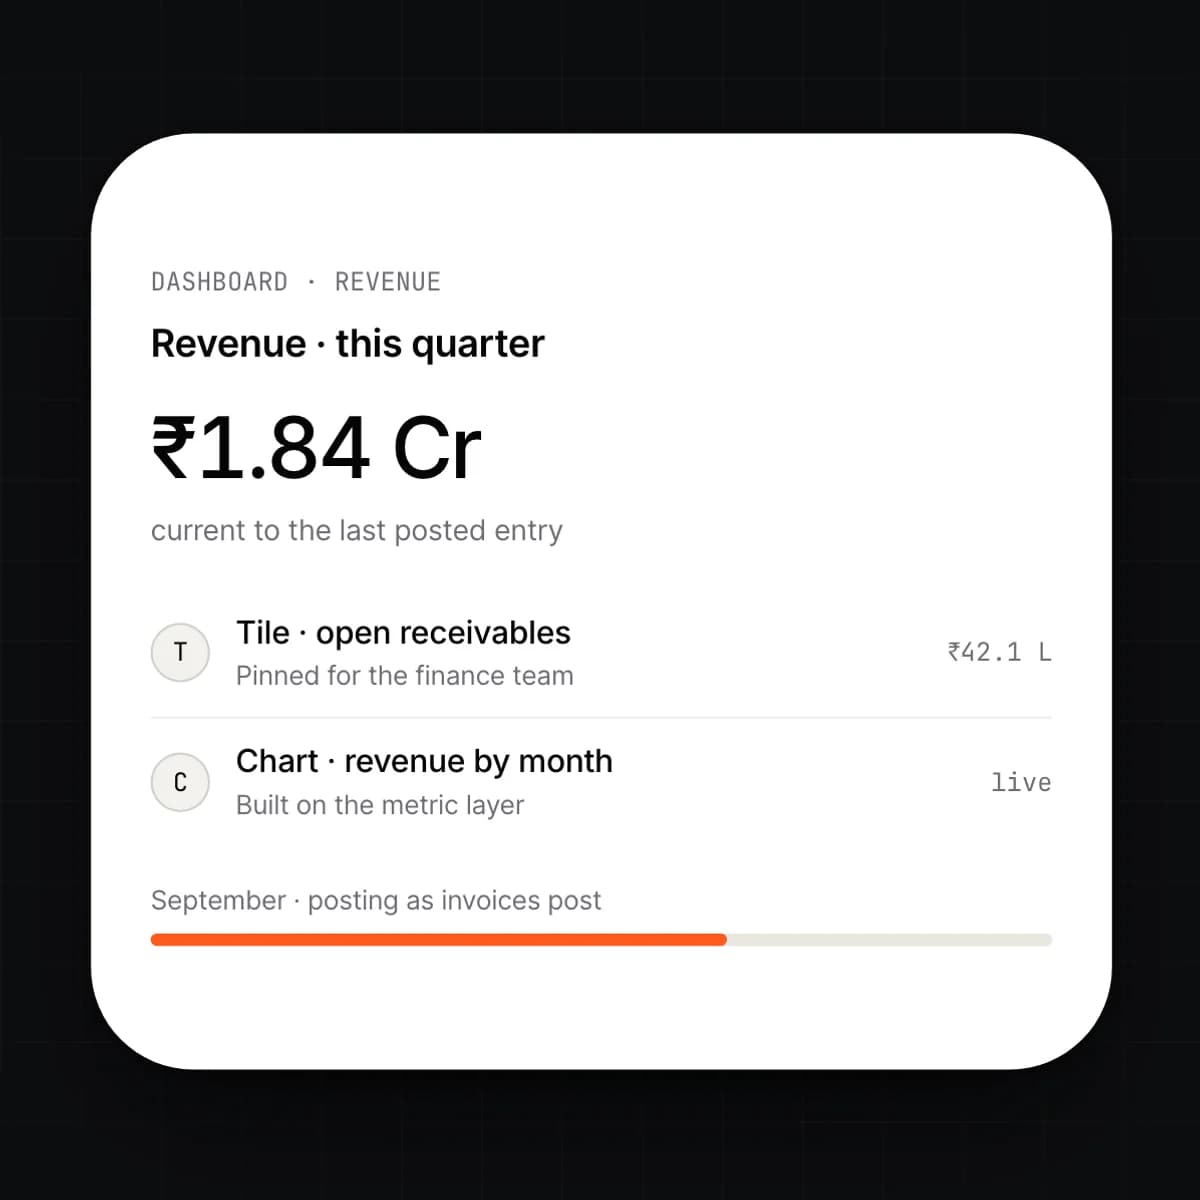
Dashboards read the ledger directly. An invoice posted in Invoicing & Finance is on the revenue chart the moment it posts. Build a dashboard from tiles, charts and tables; pin it for a team or keep it to yourself.
insight
Dashboards that read the ledger directly, questions you can ask in plain language, and a path from every figure to the entry that produced it.
question → query → figure → ledger line
THE PROBLEM
Most reporting runs on a copy. Data is exported overnight into a warehouse, reshaped, and drawn as a chart the next morning. By then the ledger has moved on. Two teams define margin differently and both are right by their own spreadsheet. When a number looks wrong, nobody can say which entry caused it.
HOW SOLONOMOUS DOES IT
Analytics reads the same ledger the other seven modules write to. There is no extraction and no nightly sync; a dashboard shows the ledger as it is now. Metrics are defined once, in a shared layer, and every chart and every answer uses that definition. Ask a question in plain language and the module writes a query you can read, run and save. Any figure opens to the entries that sum to it.
WHAT YOU GET
One set of numbers the whole company agrees on, current to the last posted entry. When a figure needs explaining, the explanation is a click away, not a week of reconciliation.
Capabilities
9 capabilities
Dashboards read the ledger directly. An invoice posted in Invoicing & Finance is on the revenue chart the moment it posts. Build a dashboard from tiles, charts and tables; pin it for a team or keep it to yourself.
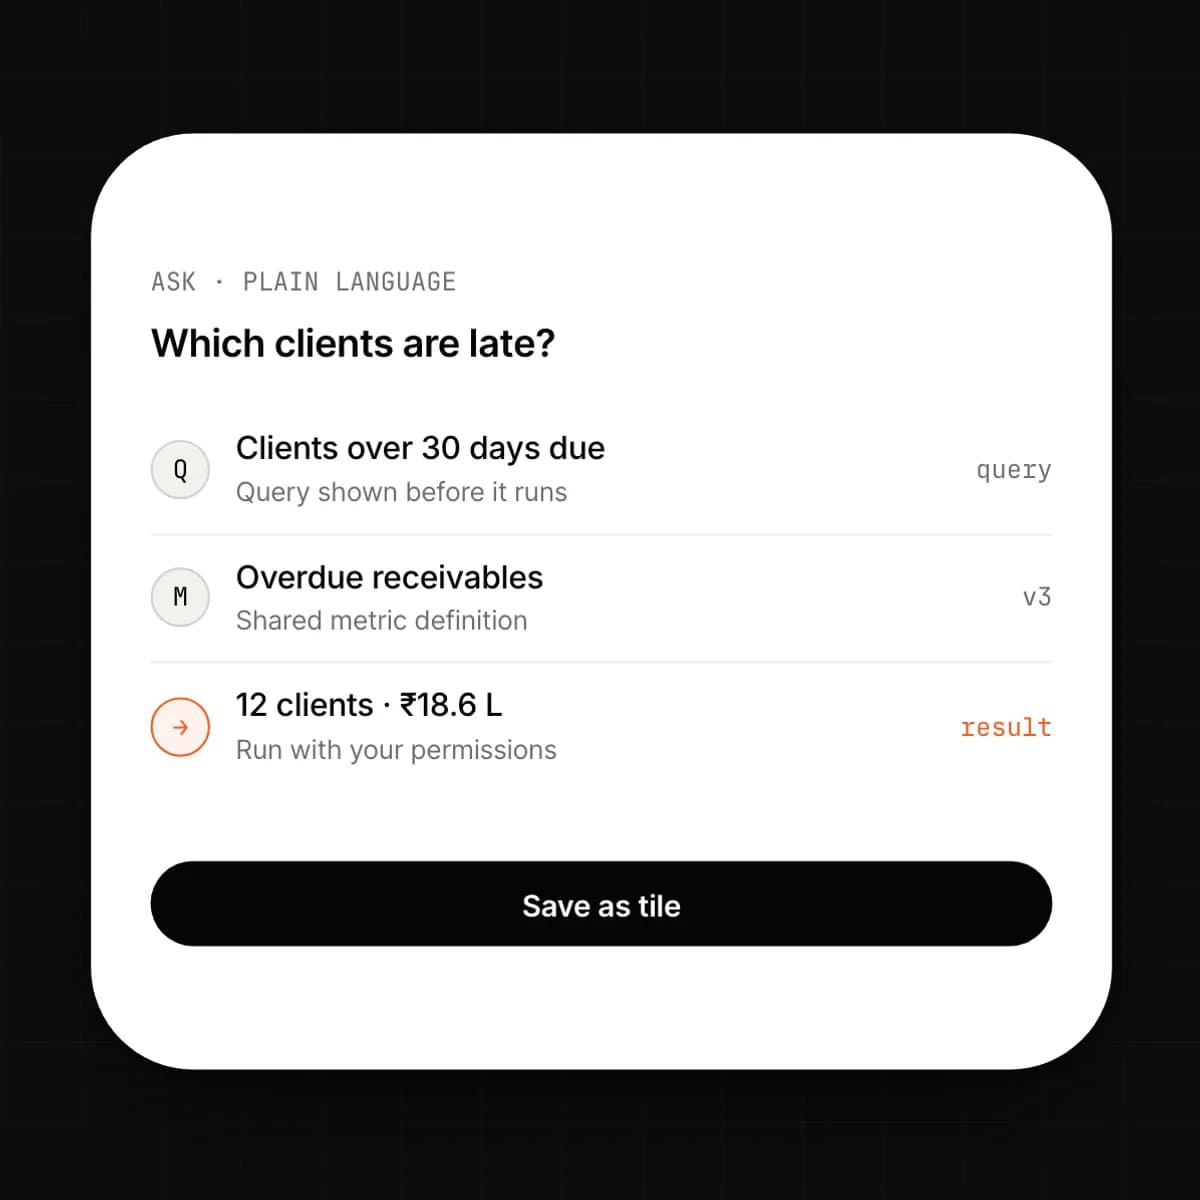
Type a question the way you would ask a colleague. The module writes a query against the metric layer, shows it to you, and runs it. Edit the query if it read you wrong, and save the result as a tile.
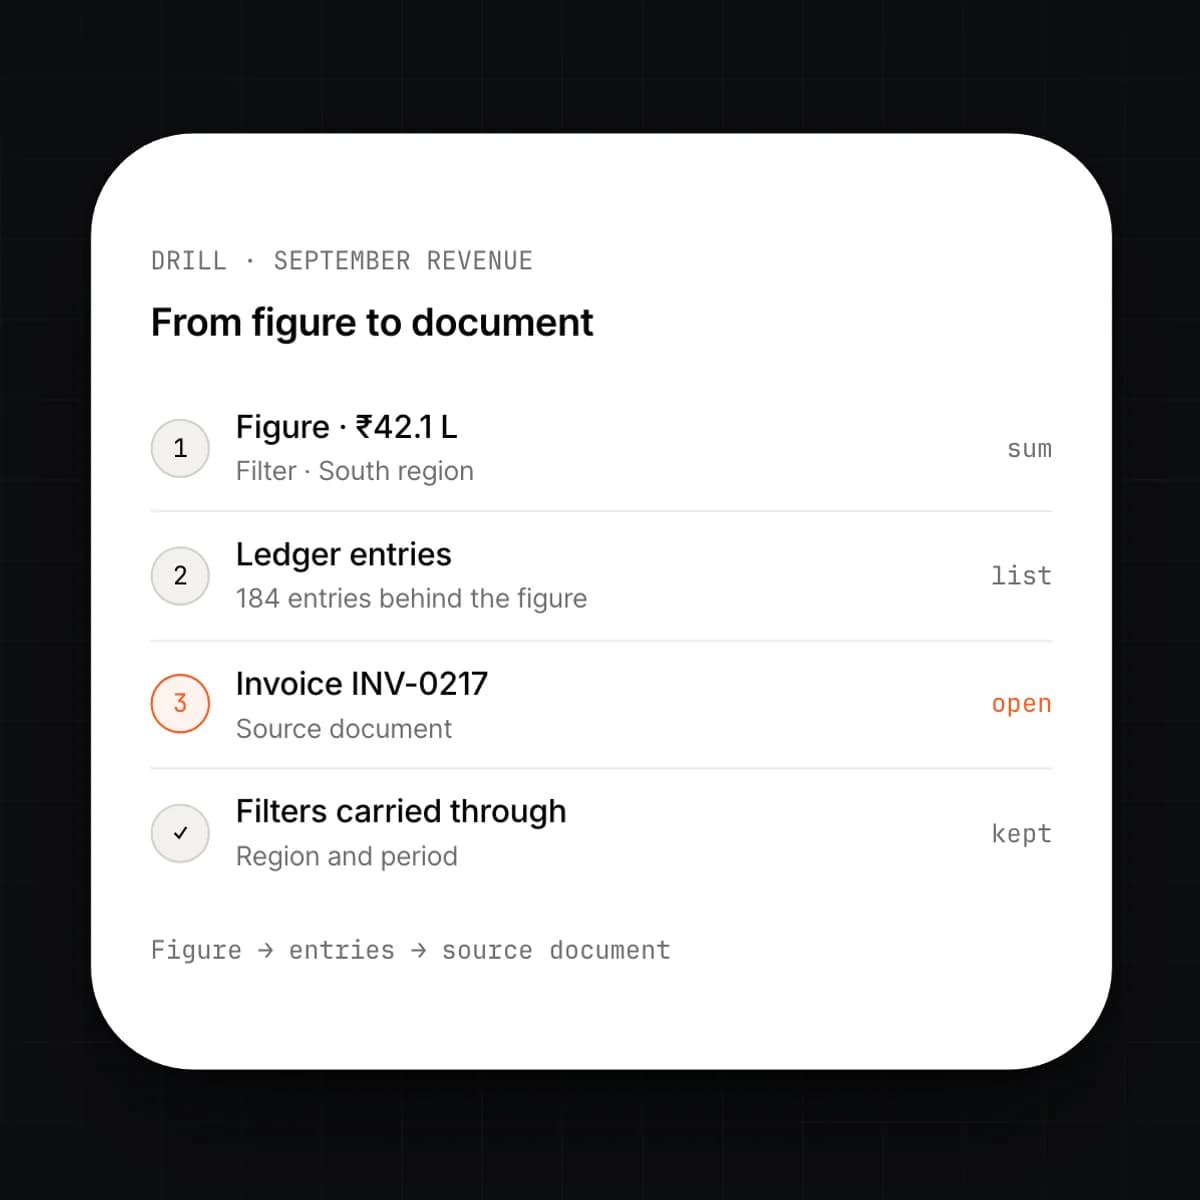
Every figure is a sum of ledger entries, so every figure can be opened. Click a bar, a total or a cell and the module lists the entries behind it, then the document behind each entry: the invoice, the payslip, the stock movement.
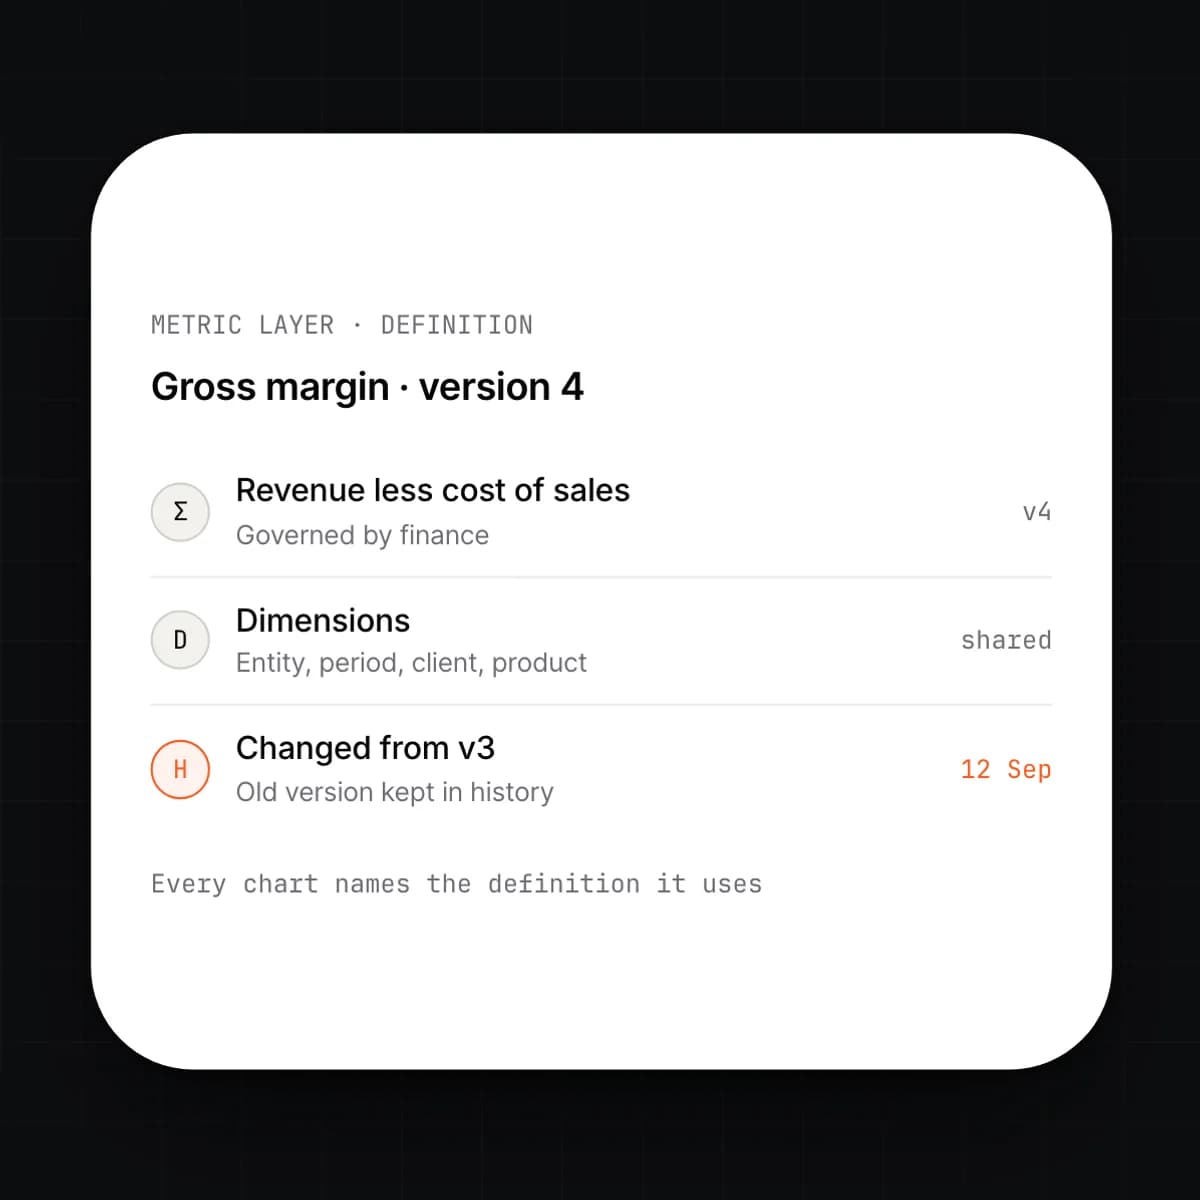
Margin, churn, stock cover and every other metric are defined once and used everywhere. Change a definition and every dashboard, report and answer changes with it, with the old version kept in the history.
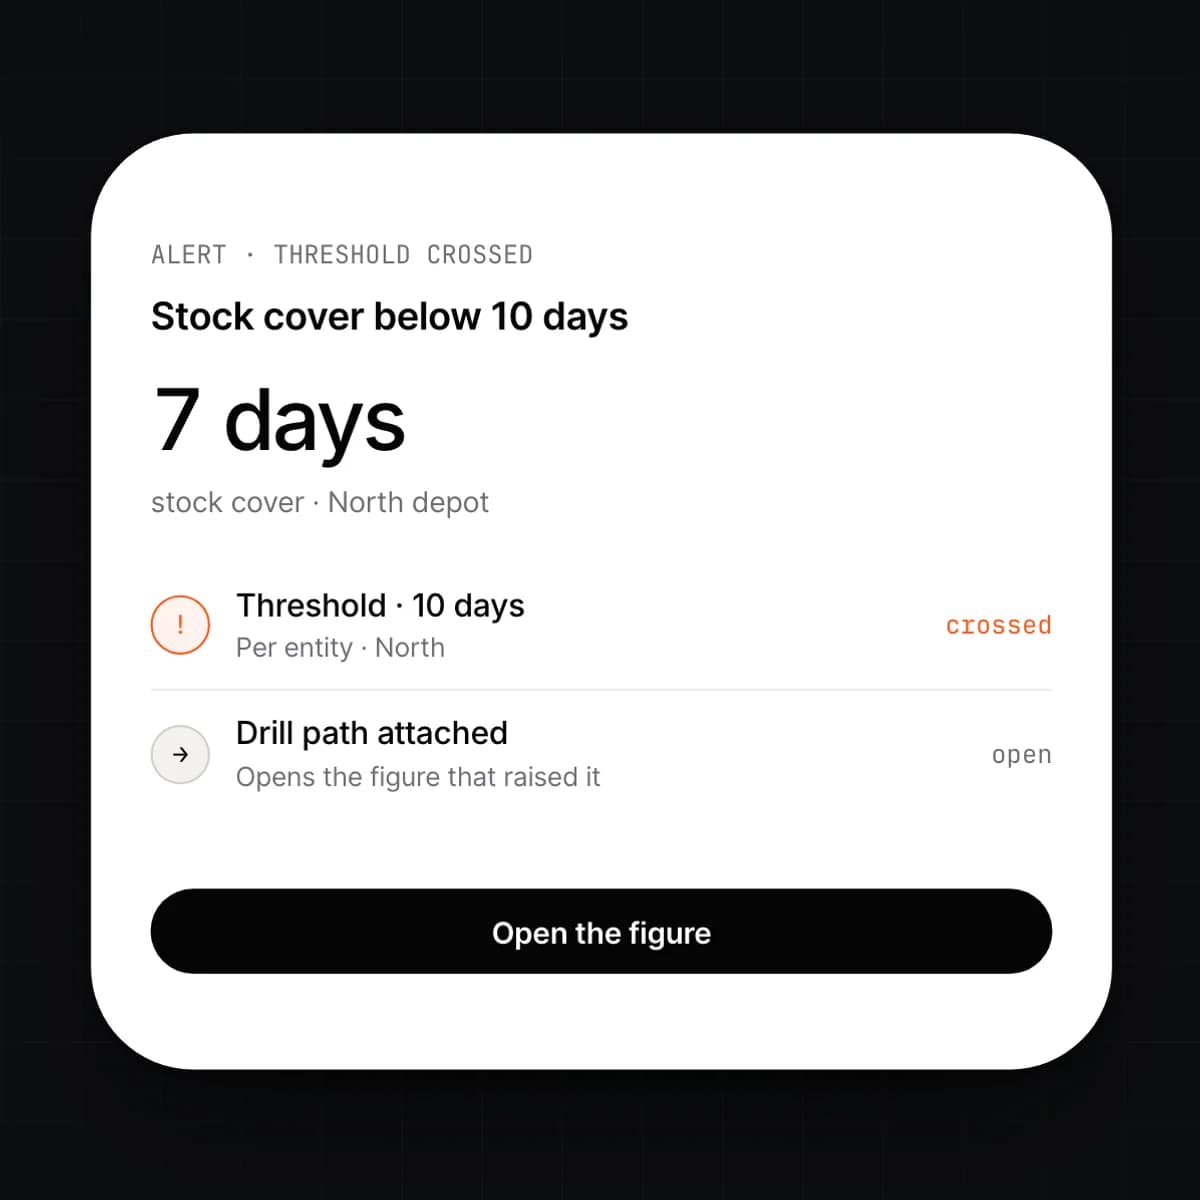
Schedule any dashboard or query to arrive by email or in a channel on a cadence. Set a threshold on a metric and the module tells the right person when it is crossed, with the drill path attached.
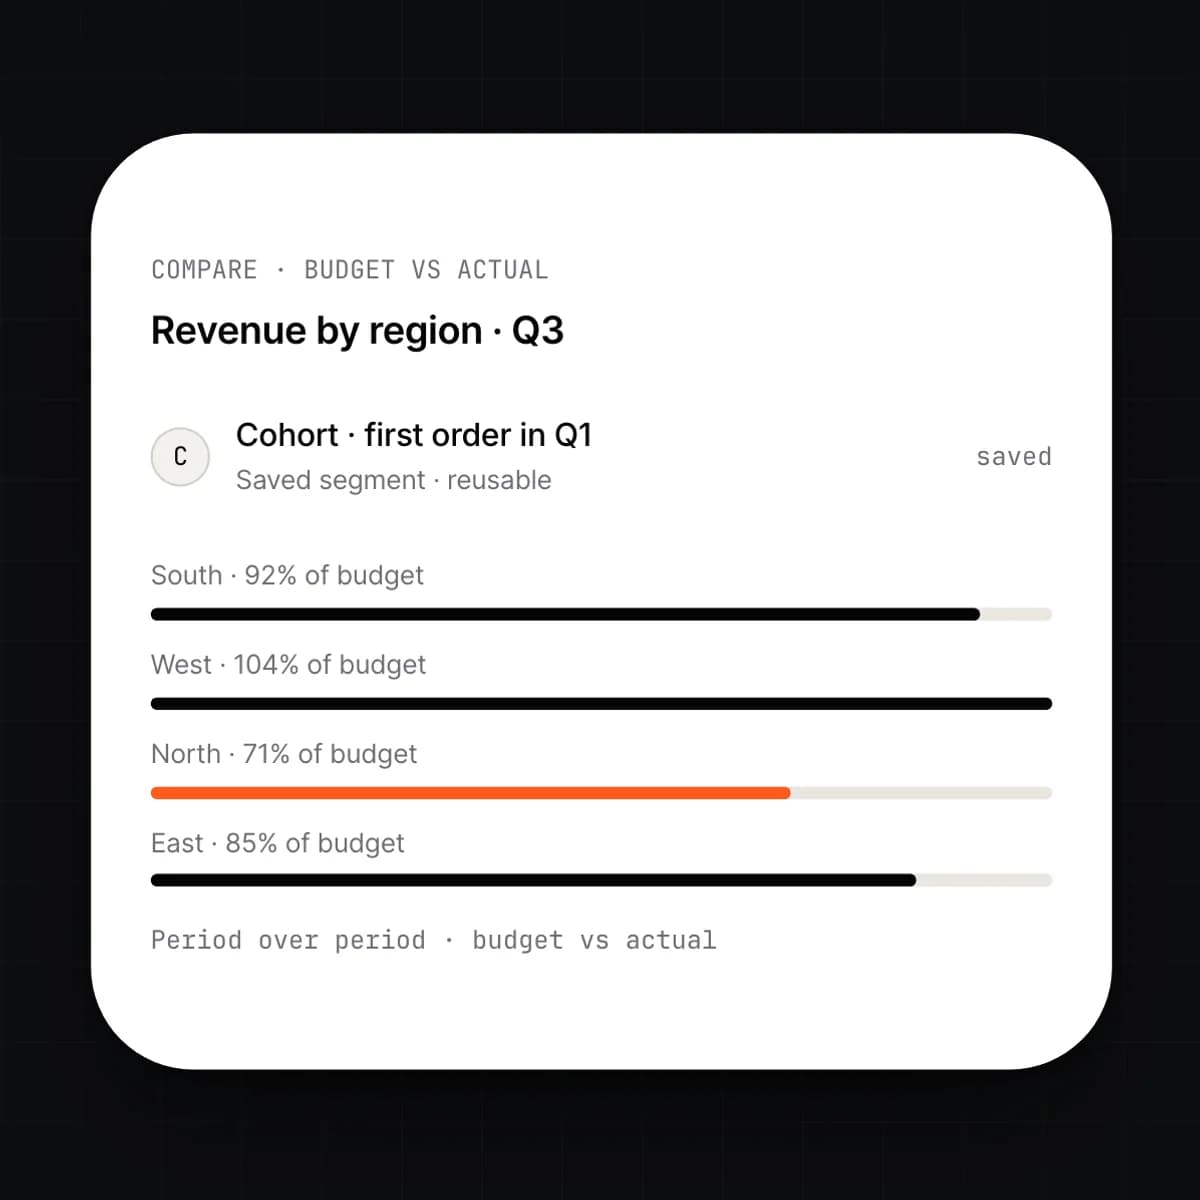
Cut any metric by client, product, region, team or a segment you define. Follow a cohort of customers from their first invoice. Compare this period with last, this entity with that, budget with actual.
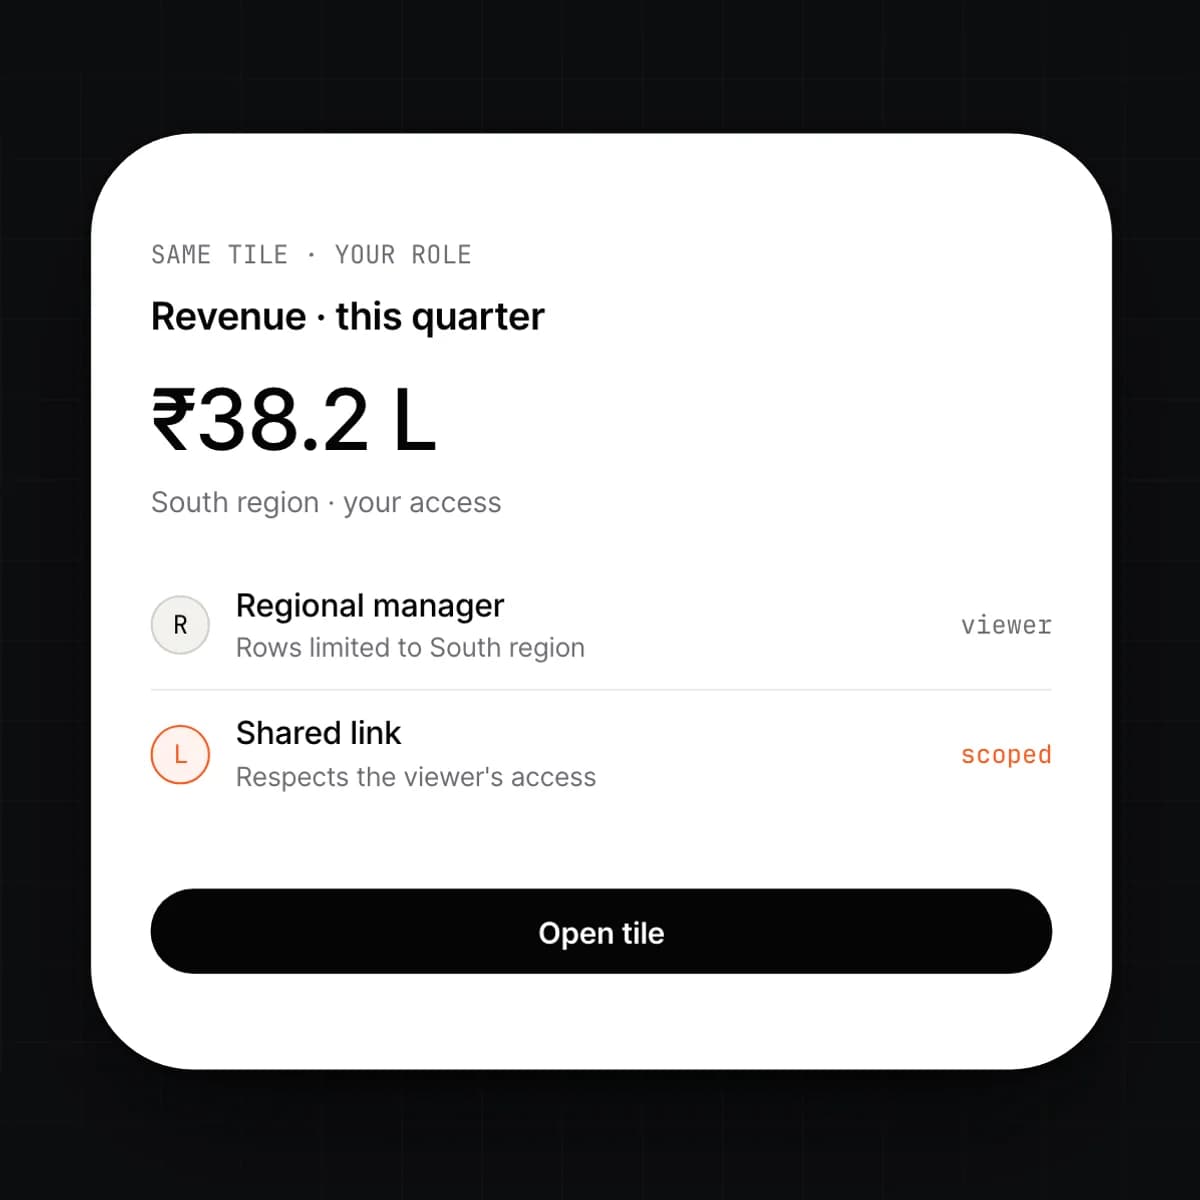
A dashboard is the same object for everyone, but each viewer sees only the rows their role can see. A regional manager sees their region's figures; a board member sees the whole. Nothing is filtered after the fact.
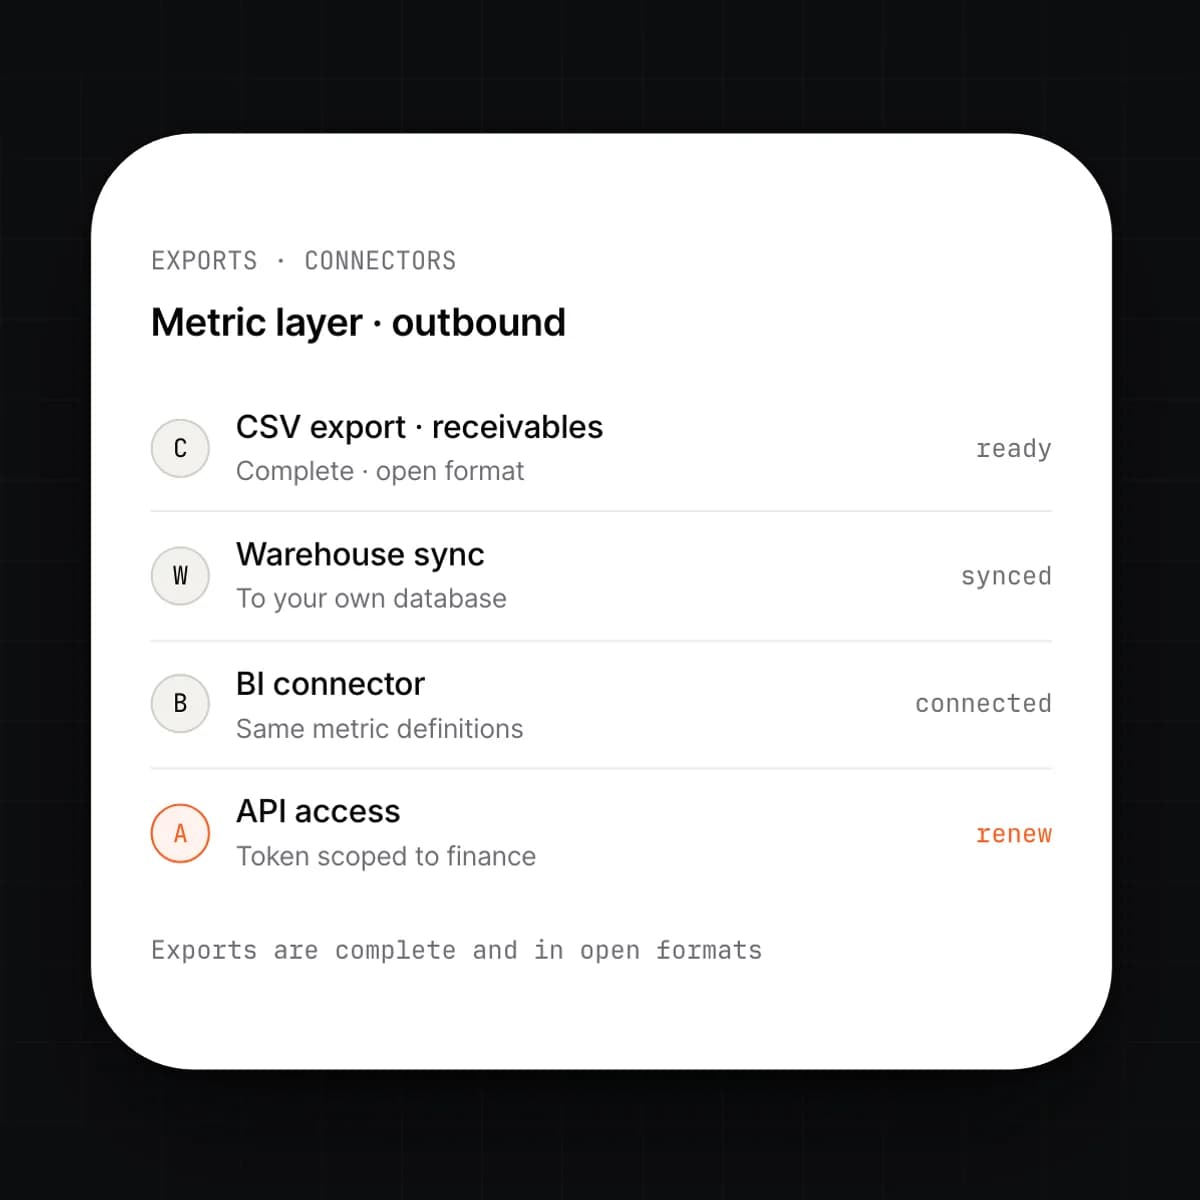
Send any result to a spreadsheet or a file, or connect your warehouse and BI tool to the metric layer so they use the same definitions. Exports are complete and in open formats.
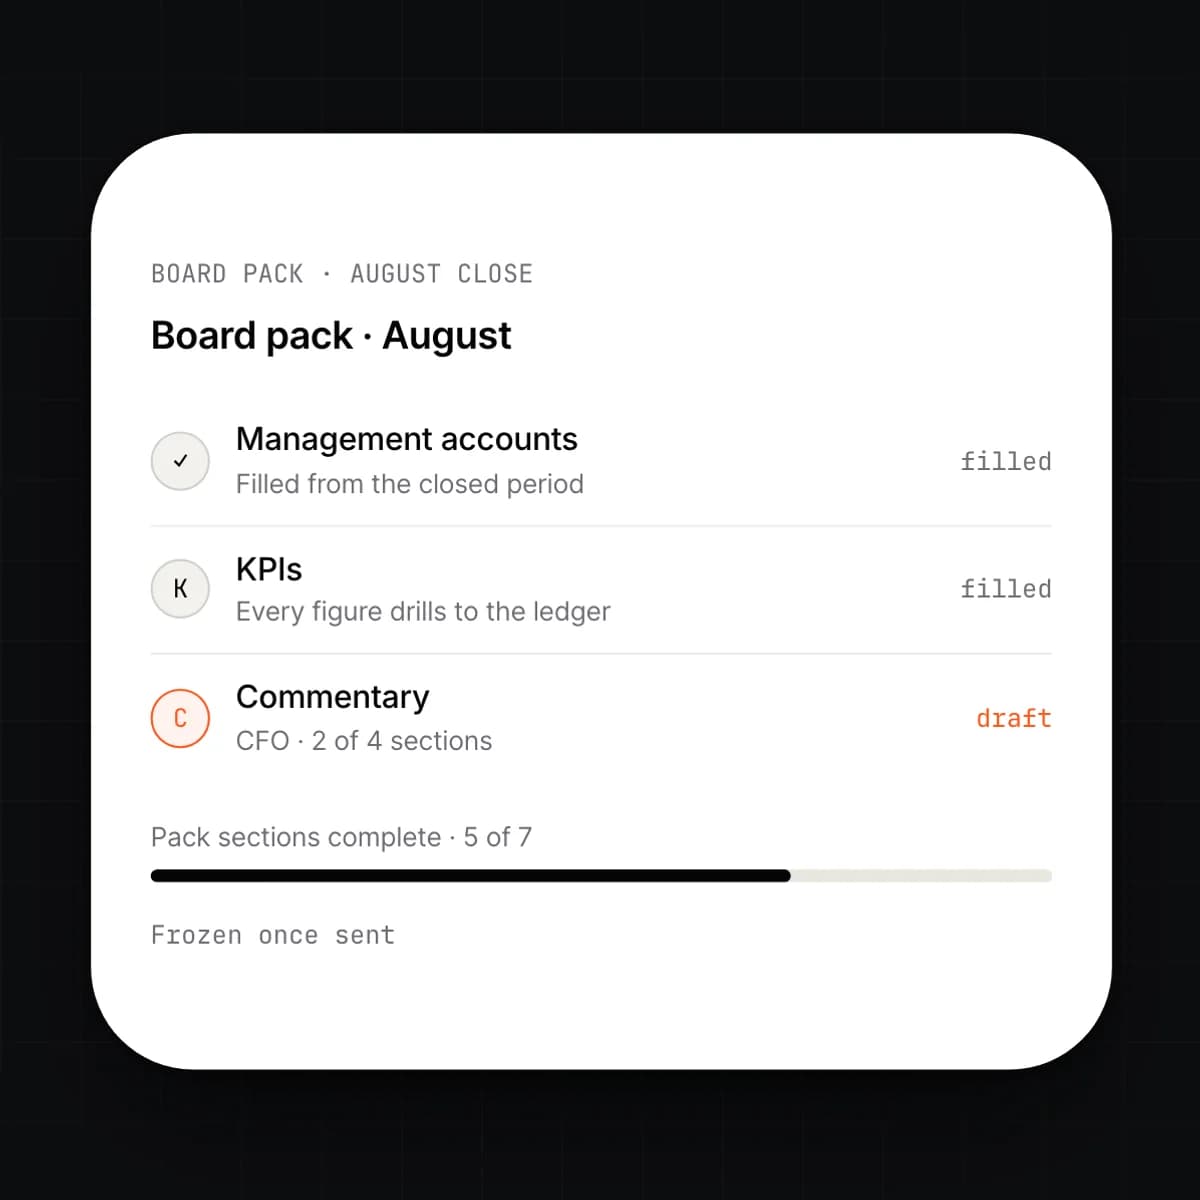
Build a board pack once and it fills itself from the closed period. The management accounts, the KPIs and the commentary go out together, and the pack is stored against the period it reports.
Capabilities
9 capabilities, one card each. Open any card to read it in full.
Workflow
What happens between typing a question and trusting the number.
Gross margin by client for the last quarter, typed into the search bar, on a dashboard or to an agent.
The module resolves margin from the metric layer, writes the query and shows it. Change it if the reading is wrong.
The query runs on the ledger as it is now, with the asker's permissions. No copy, no sync, no waiting for tonight's job.
One client looks low. Click it to see the invoices and the costs that sum to it, then the entry behind any of them.
Save it as a tile, schedule it, or set an alert on it. It keeps the definition, so next quarter it means the same thing.
Connected
Details
Questions
No. Analytics reads the ledger directly, so there is nothing to extract or load. If you already have a warehouse, connect it to the metric layer so it uses the same definitions.
As current as the ledger. A dashboard shows the last posted entry when you open it. There is no overnight job and no window during which the numbers are stale.
You can see why, because the query is shown with the answer. Edit it, re-run it and save the corrected version. Nothing is hidden behind the answer; every answer is a query you can read.
Yes, by design. Permissions are applied at query time, so a regional manager and the finance director open the same tile and see the totals their roles allow. Neither sees a figure they could not see in the ledger.
Roles with metric governance, usually finance. A change is versioned, so old reports still show which definition they used, and every dashboard that uses the metric updates at once.
Yes. Connect it to the metric layer through the warehouse sync or the API. It will report the same margin as the built-in dashboards, because it is reading the same definition.
Early access
We are onboarding a small number of companies this year. Tell us what you run today.